On this page
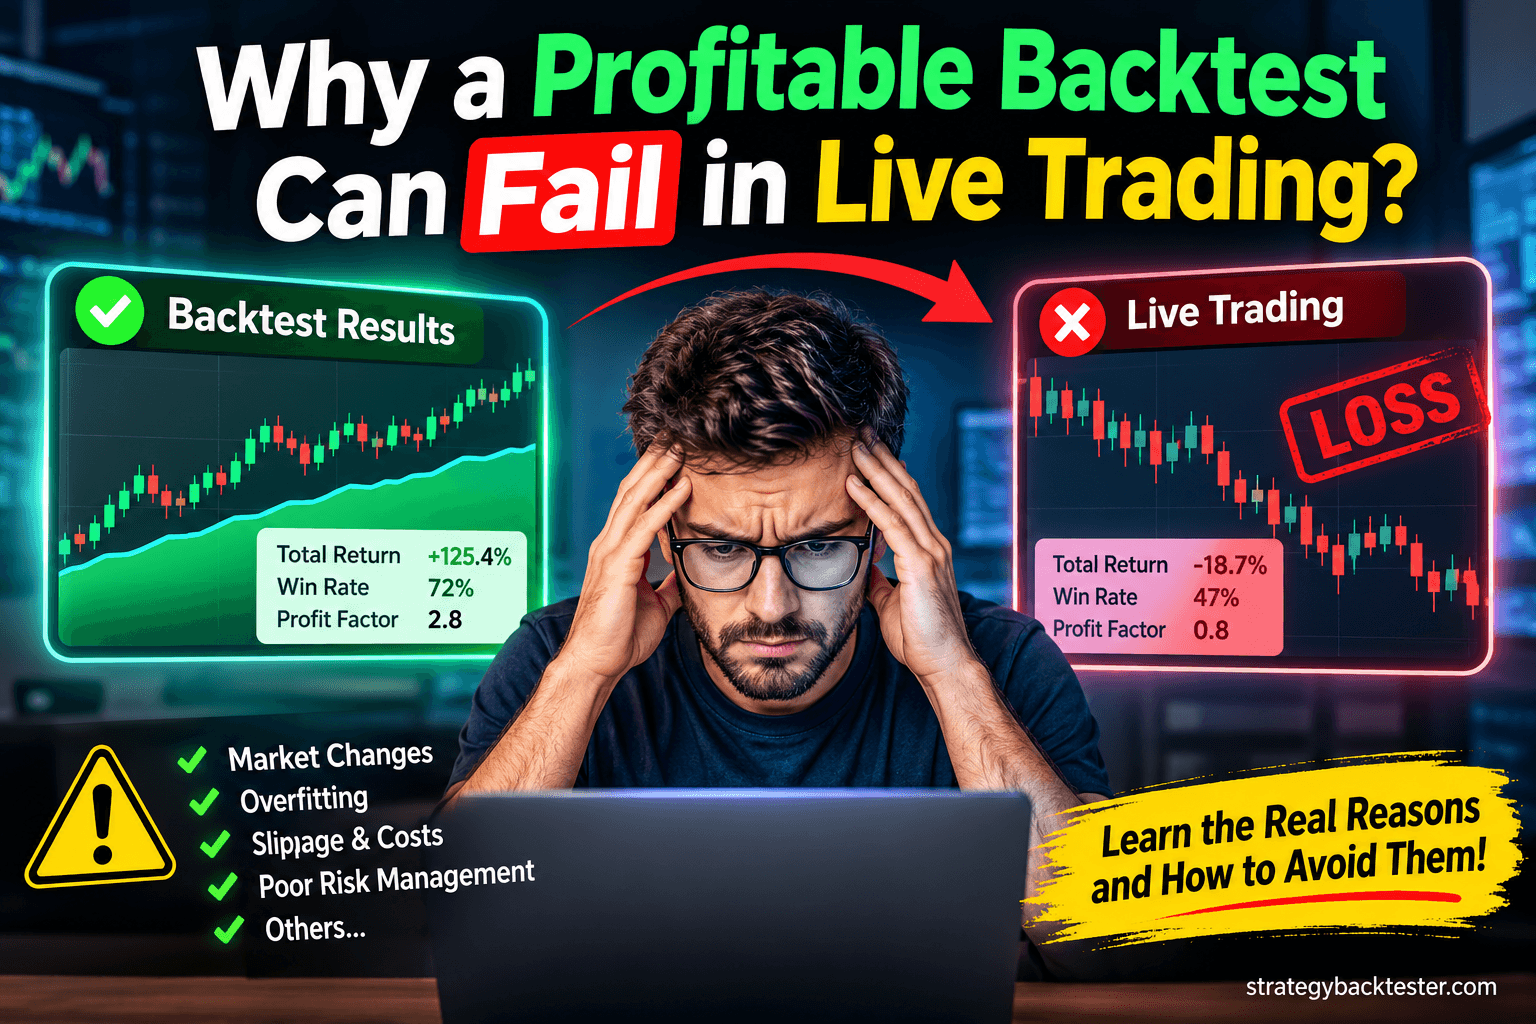
Why does a profitable backtest fail in live trading?
A backtest replays your rules on historical candles and adds up the result. Live trading is different. You pay brokerage, you get filled at worse prices than you hoped, the market behaves differently from the past, and you have to sit through losses with real money on the line.
That gap between a good-looking backtest and disappointing live results is very common, and it is rarely bad luck. It usually comes from a short list of fixable problems. This guide walks through each one in plain language, so you can check your own strategy before you risk money.
| In a backtest | In live trading | |
|---|---|---|
| Costs | Often zero or too low | Brokerage, taxes, fees and spread on every trade |
| Fills | Clean price, instant | Slippage, partial fills, gaps and delays |
| Data | Complete and tidy | Missing ticks, bad prints, session quirks |
| Market | One fixed past period | A market that keeps changing |
| You | A perfect rule follower | A person who gets scared, greedy or distracted |
Free tool
Run a stricter test in minutes
Add commission and slippage, switch to next-bar fills, and test a separate date range. Free, with no signup.
Reason 1: Overfitting (curve fitting)
Overfitting is the number one reason a profitable backtest fails live. It happens when you keep tweaking a strategy until it fits the past perfectly, so it learns the noise in that data instead of a real pattern. The result is a beautiful backtest that has no edge going forward.
How overfitting sneaks in
- Too many settings. Every extra indicator, filter and threshold gives you another way to fit the past.
- Hunting for the “best” number. Trying fast averages from 3 to 50 and keeping the single winner almost guarantees a fluke.
- Testing and tuning on the same data. If you adjust the strategy after every run, the whole period becomes your training set.
How to check for it
- Test a separate period. Tune on one stretch, then run it untouched on another. This is called out-of-sample testing. If results collapse, it was fitted to the past.
- Nudge the settings. If a fast average of 9 works but 8 and 10 lose money, the edge is fragile. A sturdy idea survives small changes.
- Keep rules simple. A strategy with two or three clear rules is harder to overfit than one with ten.
Reason 2: Ignoring brokerage, slippage and other costs
Many backtests are run with zero commission and zero slippage. That is the easiest way to make any strategy look good, and the easiest way to be surprised live. Every trade pays brokerage and fees, and every market order gives up a little price. These costs are small per trade but add up fast, especially for strategies that trade often.
The pattern is simple: the smaller your average profit per trade, the more costs matter. Here is an example with 500 trades and an average gross profit of ₹120 per trade (illustrative numbers, not a real result).
| Scenario | Avg gross profit per trade | Cost per trade | Net per trade | Total after 500 trades |
|---|---|---|---|---|
| Zero costs (looks great) | ₹120 | ₹0 | ₹120 | ₹60,000 |
| Realistic costs | ₹120 | ₹70 | ₹50 | ₹25,000 |
| Slightly worse costs | ₹120 | ₹100 | ₹20 | ₹10,000 |
| Stress test | ₹120 | ₹130 | −₹10 | −₹5,000 |
What to do about it
- Enter Commission per order and Slippage (points) in the Test setup panel before every serious run.
- Base the numbers on your own broker’s charges and the fills you actually get, not on wishful thinking.
- Re-run with costs a bit worse than expected. If the strategy still earns, the edge has some room.
Reason 3: Unrealistic fills, gaps and stop-loss assumptions
A backtest has to assume how your orders get filled, and optimistic assumptions flatter the result. In live trading you usually cannot buy at the exact close of the candle that gave the signal, and your stop-loss does not always exit at your stop price.
- Entry price. Filling at the signal candle’s close assumes you can trade at a price that has already passed. Filling at the next bar’s open is more cautious and closer to real life.
- Gaps. If the market opens beyond your stop-loss, you exit at the gap price, not your stop. A test that ignores gaps understates risk.
- Stop and target in one candle. When both fall inside a single candle, any candle-based test has to guess which came first. Strategy Backtester uses the same bar-path assumption as TradingView, but the true order is never certain.
- Fast markets. News events, opening minutes and thin crypto or forex hours often fill far from the price you expected.
Reason 4: Look-ahead bias and repainting indicators
Look-ahead bias means the backtest quietly used information that was not available at the moment of the trade. It is a silent profit machine: the test looks amazing because the strategy effectively knew the future.
- Using the whole candle too early. Deciding on the close of a bar but entering at that same bar’s open or low uses data from the future.
- Repainting indicators. Some indicators change their past values as new candles arrive, so history looks perfect while live signals keep shifting.
- Higher-timeframe data used carelessly. Pulling a daily value into an intraday strategy can leak the day’s final high, low or close into earlier bars.
The fix is to make every decision with only what was known at that time. Built-in strategies in Strategy Backtester decide on the current bar’s close and earlier data only. If you paste in a Pine Script strategy, check any repainting indicators and higher-timeframe calls, and compare a few signals by eye against the chart.
Reason 5: Too few trades or only one kind of market
Ten winning trades prove very little. With a small sample, a few lucky trades can dominate the profit, and the numbers swing wildly. A strategy that did well in a strong trend can also fall apart in a sideways market it never saw.
- Aim for 100 or more trades. Under 30 trades is closer to anecdote than evidence.
- Cover different conditions. Include trending, choppy, calm and volatile stretches, not just one bull run.
- Read the monthly table. If one great month produces all the profit, the strategy may simply have been lucky once.
- Check the exit reasons. See how many trades ended at the stop, the target or the strategy’s own signal.
Twelve months is fine for trying an idea. For a serious test, use several years of data. You can upload your own file or download more historical candles.
Reason 6: Poor or mismatched data
A backtest is only as good as its candles. Wrong data gives wrong results, and the error usually flatters the strategy.
- Bad candles. Missing bars, duplicate timestamps and wrong highs or lows can create trades that never could have happened.
- Timezone and session mismatch. If your file’s times do not match the exchange session, time-based rules such as opening range or square-off fire at the wrong moment.
- Different feed live. Your broker’s live prices can differ slightly from the file you tested on, which matters for tight stops.
- Timeframe too coarse. Daily candles hide what happened inside the day, so a stop and target can look safe when they were not.
Reason 7: Drawdowns, position size and human behaviour
A backtest never panics. You will. Even a sound strategy has losing streaks and deep drawdowns, and watching real money fall is very different from reading a number in a report.
- Drawdown you cannot tolerate. If the backtest shows a 25% drawdown and you would quit at 10%, you will not collect the profits that came after it.
- Oversized positions. A size that looks fine in a test can wipe out an account during a normal losing streak.
- Breaking your own rules. Skipping a signal after two losses, or moving a stop, quietly turns the live strategy into a different one.
- Strategy changes mid-way. Switching rules after a few bad trades means you never learn whether the original idea worked.
Read the max drawdown and the longest losing run in your report, then ask honestly whether you could follow the rules through that. For definitions and worked examples, see our guide to backtesting metrics explained.
How to make your backtest closer to live results
You cannot remove every gap between a backtest and live trading, but you can shrink it a lot. Work through these steps in Strategy Backtester before you trust a result.
- Add costs. Set Commission per order and Slippage (points) to realistic values.
- Use cautious fills. Set Entry fills at to next bar open.
- Hold back a test period. Use the From and To dates to tune on one period and run once on another.
- Nudge the settings. Change each parameter slightly and check the results stay similar.
- Try a neighbouring timeframe. A real pattern often shows up, in weaker form, on the next timeframe.
- Add trade rules. Use Max trades per day, Cooldown bars after SL and Max daily loss to mirror how you will actually trade.
- Review the whole report. Look at drawdown, profit factor, exit reasons and the monthly table, not just total profit.
Free tool
Stress-test your strategy for free
Run any built-in strategy or paste your Pine Script, add realistic costs, and see whether the edge survives.
New to the tool? Start with our guide on how to backtest a trading strategy for free.
Checklist before you go live
Once a strategy passes the tougher tests, do not jump straight to full size. Bridge the gap with a few careful steps.
- Paper trade first. Follow the live signals without real money for a few weeks and compare them with what the backtest would have done.
- Start small. Trade a fraction of your planned size until live results look similar to the test.
- Set a stop for the strategy itself. Decide in advance how much drawdown means the strategy is broken, so you are not deciding while stressed.
- Track live vs backtest. Compare win rate, average win and loss, and drawdown. A big mismatch is a warning, not bad luck.
- Re-test regularly. Markets change, so re-run the strategy on recent data now and then.
This article is for education only and is not financial advice. A backtest is a simulation on historical data and cannot predict future results. See our risk disclaimer.
Frequently asked questions
Why does my backtest look profitable but lose money in live trading?
The most common causes are overfitting to past data, leaving out brokerage and slippage, unrealistic fill assumptions, look-ahead bias, too few trades, poor data, and drawdowns that are hard to follow in real life. Add realistic costs, test on a separate date range, and compare live results with the worst case from the backtest.
What is overfitting in trading strategies?
Overfitting, also called curve fitting, is tuning a strategy so closely to past data that it learns random noise instead of a real pattern. It produces a great backtest and poor live results. Keep rules simple, avoid hunting for one perfect setting, and confirm the result on data you did not use while tuning.
What is look-ahead bias in backtesting?
Look-ahead bias happens when a backtest uses information that was not available at the time of the trade, such as a candle’s final high or low, or a repainting indicator value. It makes results look better than they could ever be live. Make every decision using only data known at that moment.
How much slippage and brokerage should I add to a backtest?
Use your own broker’s charges and the fills you actually get. If you are unsure, start with a realistic estimate, then re-run with costs somewhat worse. If the strategy still makes money, the edge has a safety margin. Costs matter most for strategies that trade often with a small profit per trade.
What is the difference between a backtest and a forward test?
A backtest replays rules on past data. A forward test, often done as paper trading, follows the same rules on live market data going forward without risking real money. Forward testing reveals problems a backtest hides, such as delays, fills and your own behaviour.
Does a high win rate mean a strategy will work live?
No. A high win rate can still lose money if the average loss is much larger than the average win, and it can be inflated by overfitting or ignored costs. Read win rate together with profit factor, average win and loss, and max drawdown.
How many trades do I need before trusting a backtest?
Aim for at least 100 trades across different market conditions. With fewer than 30 trades, the results are closer to anecdote than evidence. More trades over more years, confirmed on a separate period, give a far more reliable picture.
Should I paper trade before going live?
Yes. Paper trading for a few weeks shows whether live signals, fills and your own discipline match the backtest. After that, start with a small position size and scale up only if live results look similar to the test.
Can I check these problems with Strategy Backtester?
Yes. You can add commission and slippage, switch entry fills to the next bar open, test a separate date range with the From and To dates, and review drawdown, exit reasons and the monthly table. It is free, runs in your browser and needs no signup.
Is a backtest ever accurate?
A backtest can be a useful guide when it uses clean data, realistic costs and cautious fills, and has been confirmed on data it was not tuned on. It can never be a guarantee, because markets change and live trading adds costs and human behaviour a simulation cannot fully capture.