
On this page
Profit factor vs win rate: the short answer
If you only have time to look at one number, look at profit factor. It answers the question that matters most: does this strategy earn more than it loses? Win rate only counts how often you win, and says nothing about how much.
That does not make win rate useless. It shows how smooth or painful the ride will be, and it helps you judge whether you can stick with the rules. The sections below explain each metric, show them side by side on real-looking numbers, and give you a simple way to read them together.
| Profit factor | Win rate | |
|---|---|---|
| Question it answers | Does the strategy earn more than it loses? | How often does a trade win? |
| Considers trade size | Yes | No |
| Break-even point | 1.0 | Depends on the payoff ratio |
| Best for | Judging profitability | Judging comfort and losing streaks |
| Main weakness | Swings on a few big trades | Ignores how large wins and losses are |
What is win rate?
Win rate is the share of your trades that made money. If you took 100 trades and 45 were winners, your win rate is 45%.
Win rate formula
Win rate = Winning trades ÷ (Winning + Losing trades) × 100
Strategy Backtester leaves breakeven trades out of this ratio, so check how any other tool defines it before you compare numbers.
Win rate is easy to understand, which is exactly why it misleads people. It treats a ₹100 win and a ₹10,000 win as the same single win, and a ₹100 loss and a ₹10,000 loss as the same single loss.
What is profit factor?
Profit factor compares everything your winning trades made with everything your losing trades lost. It tells you how many rupees you earned for every rupee you lost.
Profit factor formula
Profit factor = Gross profit ÷ |Gross loss|
Strategy Backtester shows ∞ when there are no losing trades at all.
- Below 1.0: the strategy lost money.
- Exactly 1.0: break-even, before any costs.
- Above 1.0: the strategy made money. For example, 1.5 means ₹1.50 won for every ₹1 lost.
As a rough guide, a profit factor under 1.2 is thin, 1.3 to 2.0 is healthy, and anything above about 2.5 deserves suspicion of overfitting, especially on a small number of trades. For more metrics and a full worked example, see our guide to backtesting metrics explained.
Why a high win rate can still lose money
Here are three strategies, each taking 100 trades. The numbers are illustrative, before any costs, and chosen to show how the two metrics can disagree.
| Strategy A | Strategy B | Strategy C | |
|---|---|---|---|
| Win rate | 70% | 35% | 50% |
| Average win | ₹500 | ₹3,000 | ₹1,200 |
| Average loss | ₹1,500 | ₹1,000 | ₹1,000 |
| Payoff ratio (avg win ÷ avg loss) | 0.33 | 3.00 | 1.20 |
| Profit factor | 0.78 | 1.62 | 1.20 |
| Net profit | −₹10,000 | +₹40,000 | +₹10,000 |
| Average per trade | −₹100 | +₹400 | +₹100 |
Strategy A feels wonderful, with seven winners out of every ten trades. But its average loss is three times its average win, so a handful of losses erase a long run of small wins. This is the classic pattern behind a high win rate that quietly loses money: many small wins and a few large losses.
Strategy B is the opposite. It loses nearly two trades out of three, yet each winner is three times the size of each loser, so it comes out well ahead. Profit factor ranks the three strategies correctly (B, then C, then A). Win rate ranks them backwards.
How profit factor and win rate are connected
The two metrics are not rivals. They are linked by the payoff ratio, which is the average win divided by the average loss. Once you see the link, it is easy to judge any combination.
The link between the three
Profit factor = [Win rate ÷ (1 − Win rate)] × Payoff ratio
This treats breakeven trades as absent. Win rate is used as a fraction here, so 40% is 0.40.
Check it with Strategy B: [0.35 ÷ 0.65] × 3.0 = 0.538 × 3.0 = 1.62. It matches the table above. The same payoff ratio also tells you the break-even win rate, the lowest win rate at which a strategy still avoids losing money.
Break-even win rate
Break-even win rate = 1 ÷ (1 + Payoff ratio)
| Payoff ratio | Break-even win rate | What it means |
|---|---|---|
| 0.5 | 67% | Small wins, big losses. You must win about two in three. |
| 1.0 | 50% | Equal wins and losses. A coin flip breaks even. |
| 2.0 | 33% | You can lose two trades out of three and still break even. |
| 3.0 | 25% | You can lose three trades out of four and still break even. |
This is why Strategy A fails. At a payoff ratio of 0.33 its break-even win rate is 75%, and its actual 70% falls short. Strategy B needs only 25% and delivers 35%.
When profit factor can mislead you
Profit factor is the better headline number, but it has blind spots of its own. Watch for these before you trust a single reading.
- Too few trades. A profit factor of 3.0 on 15 trades is closer to luck than skill. Aim for 100 or more trades.
- One huge winner. A single lucky trade can lift the whole ratio. Check the best trade and the monthly table to see if profit is spread out or concentrated.
- It ignores drawdown. Two strategies can share a profit factor of 1.6 while one falls 10% and the other falls 40% along the way.
- It ignores the order of trades. A long losing streak at the start can break your account or your nerve, even if the final ratio looks fine.
- An unusually high value. A profit factor above 2.5 often means overfitting or missing costs, not a miracle strategy.
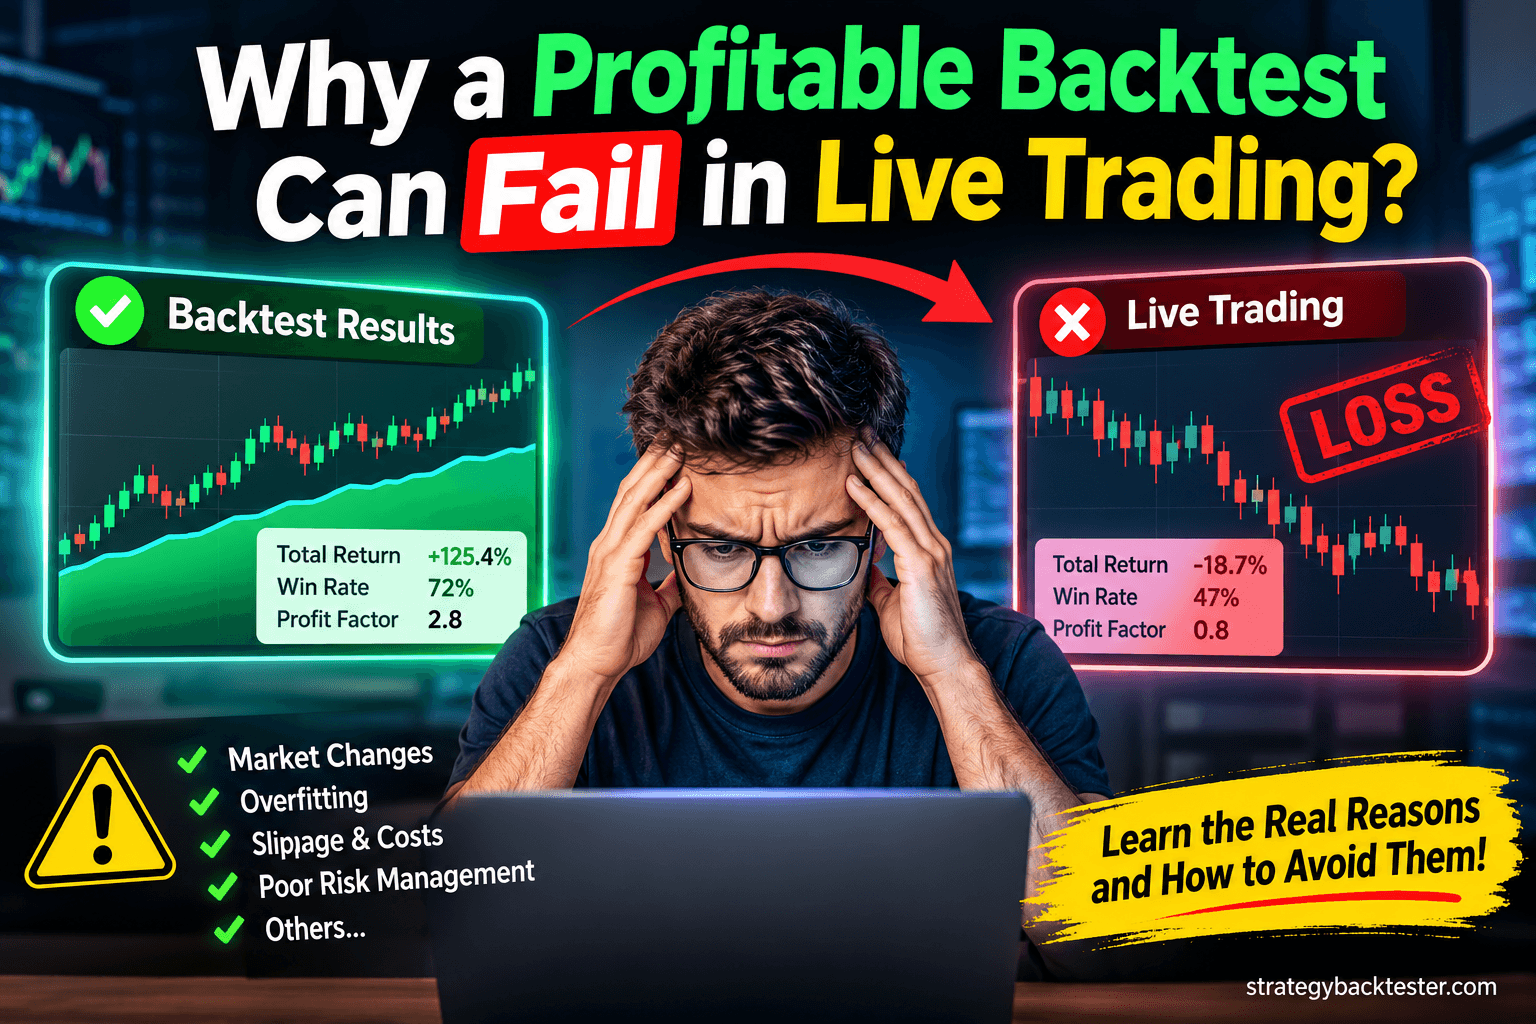
Many profitable-looking backtests fail for exactly these reasons. See why a profitable backtest can fail in live trading for the full list and how to fix each one.
When win rate really does matter
Win rate may not decide profitability, but it strongly shapes how a strategy feels, and you can only profit from a strategy you actually follow.
- Losing streaks. A strategy that wins 35% of the time will regularly lose six, eight or more trades in a row. A strategy that wins 70% rarely does. Ask yourself whether you could keep trading through that.
- Your temperament. Some people handle frequent small losses and a few big winners calmly. Others need frequent wins to stay disciplined. Neither is wrong, but your strategy must suit you.
- Scalping and high-frequency styles. When each win is small, a modest drop in win rate quickly turns profit into loss, because costs eat the thin margin.
- Risk of ruin. A low win rate combined with oversized positions can wipe out an account during an ordinary bad run.
So which one matters more?
Profit factor matters more for judging whether a strategy makes money. Win rate matters more for judging whether you can trade it. Looking at only one is how people end up with a strategy that is either unprofitable or unbearable.
A better habit is to read a small set of numbers together:
- Profit factor. Is it above 1, and ideally between 1.3 and 2.0 after costs?
- Average win and average loss. What payoff ratio do they give you, and does it fit the win rate?
- Number of trades. Are there at least 100, across different market conditions?
- Max drawdown. Could you sit through the worst fall without breaking your rules?
- Expectancy. Is the average trade positive after brokerage and slippage?
Free tool
See both numbers for your own strategy
Run a built-in strategy or paste your Pine Script, add commission and slippage, and read profit factor, win rate, average win and loss, and max drawdown side by side. Free, with no signup.
How to check both in a backtest report
You do not need a spreadsheet. After a run, the results summary shows profit factor, win rate, total PnL and max drawdown together, and the trades table lets you check the details behind them.
- Start with profit factor and total PnL. Is the strategy profitable after the costs you entered?
- Compare win rate with average win and average loss. Use the break-even table above to check that the win rate clears the line for your payoff ratio.
- Look at the monthly table. See whether profit is steady or comes from one lucky month.
- Check the exit reasons. Find out how many trades ended at the stop, the target or the strategy’s own signal.
- Re-run with worse costs. If the profit factor drops close to 1.0, the edge is thin.
New to the tool? Start with our guide on how to backtest a trading strategy for free.
This article is for education only and is not financial advice. A backtest is a simulation on historical data and cannot predict future results. See our risk disclaimer.
Frequently asked questions
Which is more important, profit factor or win rate?
Profit factor is more important for judging whether a strategy makes money, because it accounts for the size of wins and losses. Win rate only counts how often you win. Win rate still matters for judging losing streaks and whether you can follow the strategy, so read the two together with max drawdown and trade count.
What is a good profit factor?
As a rough guide, below 1.0 loses money, 1.0 to 1.2 is thin, 1.3 to 2.0 is healthy, and above about 2.5 deserves suspicion of overfitting or too few trades. Always check it after brokerage and slippage, and on at least 100 trades.
What is a good win rate for a trading strategy?
There is no single good win rate. It depends on the payoff ratio. A strategy with equal average wins and losses needs more than 50% winners, while one with winners twice the size of losers can break even at about 33%. Judge win rate together with average win and average loss.
Can a strategy with a low win rate be profitable?
Yes. Many trend-following strategies win only 35% to 45% of trades and still make money because the average winner is much larger than the average loser. The break-even win rate falls as the payoff ratio rises.
Can a strategy with a high win rate lose money?
Yes. If the average loss is much larger than the average win, a strategy can win 70% or more of its trades and still lose money overall. This pattern, many small wins and a few large losses, is common and easy to miss when you only watch win rate.
How do profit factor and win rate relate to each other?
They are linked by the payoff ratio, which is average win divided by average loss. Profit factor equals win rate divided by (1 minus win rate), multiplied by the payoff ratio. A higher payoff ratio means you need a lower win rate to reach the same profit factor.
What is the break-even win rate?
It is the lowest win rate at which a strategy avoids losing money, equal to 1 divided by (1 plus the payoff ratio). A payoff ratio of 1 needs 50%, a ratio of 2 needs about 33%, and a ratio of 0.5 needs about 67%. Costs push the real number higher.
Is profit factor or expectancy better?
They answer related questions. Profit factor shows rupees won per rupee lost, while expectancy shows the average amount earned per trade. Expectancy must be positive after costs for a strategy to work, and profit factor above 1 means the same thing. Read both, plus drawdown.
How many trades do I need before trusting profit factor and win rate?
Aim for at least 100 trades across different market conditions. With fewer than 30 trades, both numbers are closer to anecdote than evidence. Confirm the result on a date range you did not use while tuning the strategy.
Where can I see profit factor and win rate for my strategy?
Strategy Backtester shows profit factor, win rate, total PnL and max drawdown after every run, and you can export the full trades table to CSV. It is free, runs in your browser and needs no signup.